Analytics Dashboard Prompt (Full Web App With Charts)
Analytics Dashboard Prompt 📊
Need an admin panel or analytics view? This prompt builds a complete dashboard web app — sidebar, KPI cards, charts, data tables — from one description.
The prompt
Build a responsive analytics dashboard web app for [BUSINESS TYPE, e.g. a subscription coffee brand].

Layout: left sidebar navigation (Overview, Revenue, Customers, Products, Settings) that collapses on mobile; main area with:
1) 4 KPI cards — MRR, Active users, Churn rate, Conversion rate — each with a trend badge (▲/▼ vs last month),
2) revenue line chart + orders bar chart for the last 12 months side by side,
3) recent transactions table (customer, product, amount, status pill: paid/pending/refunded),
4) date-range picker filtering all widgets.

Style: dark theme with [ACCENT COLOR, e.g. emerald] accents, card-based layout, clean data-visualization, Inter font. Use realistic sample data. Charts must render with a real charting library, fully interactive with tooltips.
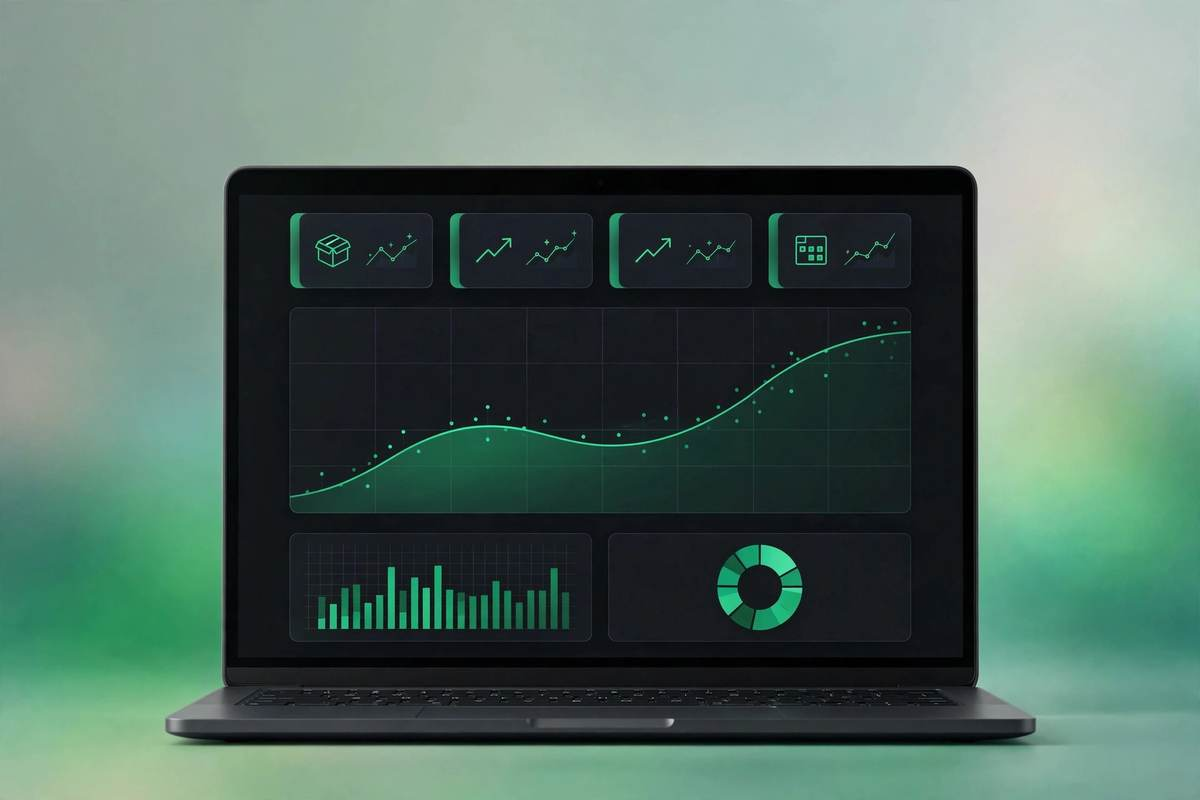
Preview — what this prompt creates
Mockup preview — paste the prompt into Lovable or Bolt to get a working dashboard app in this style.
Best AI tools for this
- Lovable — full-stack with database integration
- Bolt — fast app prototyping with backend
- v0 — beautiful UI components, pair with your own backend
- Replit AI — generate + host + add auth in one place
Make it yours
- [BUSINESS TYPE] — the AI tailors KPIs and sample data to it
- KPIs — swap in your real metrics: “CAC, LTV, NPS, refund rate”
- Theme — “light theme with indigo accents” for a corporate feel
Pro tips
- Start with sample data, then connect a real database second — don’t mix the steps.
- Ask follow-ups like “add CSV export to the transactions table”.
- Keep dashboards to one screen of KPIs — if it scrolls forever, it’s a report, not a dashboard.